
Accountants always follow one specific rule. When an outside auditor asks you for information you give the absolute minimum that is required while still satisfying the request. An example would be that if you are asked to provide sales for a particular period, you don't give information pertaining to any other period. Why? Because comparing different periods allows you to see trends and anomalies. This will trigger more questions and requests for more information. Meaning more work for you.
Quarterly earnings releases aren't much different. Even if the results are good, the last thing the CFO wants is to spur a bunch of questions from outsiders. So you, the public, are going to get the bare minimum. Any trend analysis is on you.
Which is why the first thing I always do is lay a company's results right next to the previous four quarters. This allows me to see the same quarter in the previous year and all the action in between. I like to see the same quarter in the previous year to account for seasonal changes. But I don't like looking much further back than a year because you start comparing apples to oranges which can lead you to make false conclusions. The cost of raw materials, fuel, or even currency fluctuations can all start to render income statements incomparable.
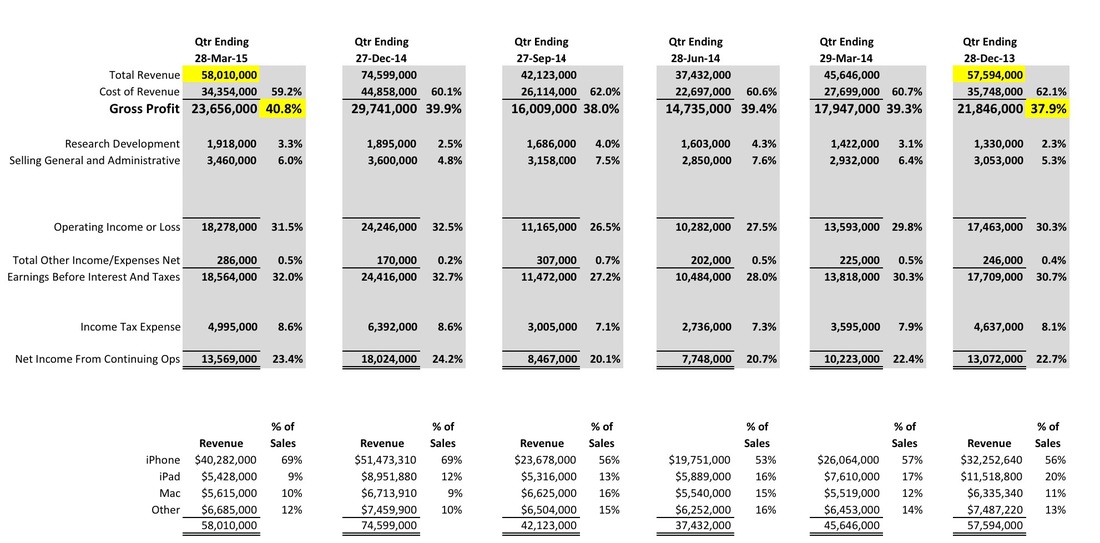
However, I'm going to break my rule this time because there's a juicy comparison between this most recent quarter ending 29-Mar-15 and the holiday quarter of 28-Dec-13 that is too good to pass up. The revenue for both quarters is about $58 billion. Why is this relevant? Because a company always tries to "leverage their fixed costs", meaning that they want to increase sales without increasing their cost structure (hiring more managers, building more plants, etc). So the more you sell, the more profitable you look.
By comparing Apple's two quarters which both have revenue of around $58 billion, we can get a glimpse of any changes to profitability due to its pricing power and not due to manufacturing efficiencies. What we see is that Apple is able to pull in a little more revenue in 2015 while spending $1.3 billion less in manufacturing costs to do it. And you can't pin this on higher volume because they are comparable. So it has to be either higher prices or mix changes. And in this case, we have both.
iPhone 6 Plus - At a time when most phone manufacturers are happy if they don't have to cut prices, Apple was able to introduce a higher-priced phone. Apple doesn't share with us the mix between the higher-priced 6 Plus and the less expensive iPhone 6. But you must conclude when you see the gross margin increase of 1.9 points compared to the 2013 holiday quarter, the 6 Plus is finding lots of happy owners willing to remove their phone from their pocket just to sit comfortably.
iPad - This could be coincidental, but it almost seems as if the fewer iPads Apple sells, the more profitable they are. It's an iOS device that commands a much higher price than anyone else's tablets, so I think that most people assume that the gross margins are pretty good. Plus, Apple was content to let the iPad cannibalize Mac sales, so it can't be doing worse than their computer business. But with a lower volume to spread its fixed costs over, there's a good chance that the margins on the iPad are significantly less than the iPhone. Which means that if the iPhone 6 Plus is cannibalizing iPad sales, no one at Apple is shedding any tears.
Remember earlier when I said that companies try to leverage their fixed costs and increase sales without increasing their cost structure? Well, Apple has so much pricing power that they were able to increase their gross margins from the previous 2014 holiday quarter even though they had less volume. They might as well invent water that runs up hill. They dropped over $16 billion in sales revenue and managed to increase their gross margin by almost one full point. The cost structure that they had to put in place to ship $75 billion of product for the 2014 holiday didn't magically go away. Apple has to pay for all those fixed costs every month of the year even if sales go down. But even with that, they still increased their gross margins. My guess is that the iPhone 6 Plus supply was constrained during the October through December period but Apple corrected whatever supply chain issues they had in Q2.
So yes, Apple had another great quarter. But does this level of performance support a market capitalization value of $700 billion? If I take the present value of a future of quarters like the last two will it even come close to $700 billion? Remember, the stock price is simply the present value of future earnings. It's like winning the lottery and taking the immediate lump sum payout. The lump sum payout is the present value of twenty years of payments. Likewise, market cap is the present value of all future earnings. Those earnings belong to the stockholders and must be either returned via dividends or reinvested in the company.
The question which perplexes me is if the current level of profitability doesn't support the market cap, how much would Apple have to grow to fulfill expectations? This has been nagging at me for a little while now, but you'll have to check back later to see what the math says.
Which is why the first thing I always do is lay a company's results right next to the previous four quarters. This allows me to see the same quarter in the previous year and all the action in between. I like to see the same quarter in the previous year to account for seasonal changes. But I don't like looking much further back than a year because you start comparing apples to oranges which can lead you to make false conclusions. The cost of raw materials, fuel, or even currency fluctuations can all start to render income statements incomparable.
However, I'm going to break my rule this time because there's a juicy comparison between this most recent quarter ending 29-Mar-15 and the holiday quarter of 28-Dec-13 that is too good to pass up. The revenue for both quarters is about $58 billion. Why is this relevant? Because a company always tries to "leverage their fixed costs", meaning that they want to increase sales without increasing their cost structure (hiring more managers, building more plants, etc). So the more you sell, the more profitable you look.
By comparing Apple's two quarters which both have revenue of around $58 billion, we can get a glimpse of any changes to profitability due to its pricing power and not due to manufacturing efficiencies. What we see is that Apple is able to pull in a little more revenue in 2015 while spending $1.3 billion less in manufacturing costs to do it. And you can't pin this on higher volume because they are comparable. So it has to be either higher prices or mix changes. And in this case, we have both.
iPhone 6 Plus - At a time when most phone manufacturers are happy if they don't have to cut prices, Apple was able to introduce a higher-priced phone. Apple doesn't share with us the mix between the higher-priced 6 Plus and the less expensive iPhone 6. But you must conclude when you see the gross margin increase of 1.9 points compared to the 2013 holiday quarter, the 6 Plus is finding lots of happy owners willing to remove their phone from their pocket just to sit comfortably.
iPad - This could be coincidental, but it almost seems as if the fewer iPads Apple sells, the more profitable they are. It's an iOS device that commands a much higher price than anyone else's tablets, so I think that most people assume that the gross margins are pretty good. Plus, Apple was content to let the iPad cannibalize Mac sales, so it can't be doing worse than their computer business. But with a lower volume to spread its fixed costs over, there's a good chance that the margins on the iPad are significantly less than the iPhone. Which means that if the iPhone 6 Plus is cannibalizing iPad sales, no one at Apple is shedding any tears.
Remember earlier when I said that companies try to leverage their fixed costs and increase sales without increasing their cost structure? Well, Apple has so much pricing power that they were able to increase their gross margins from the previous 2014 holiday quarter even though they had less volume. They might as well invent water that runs up hill. They dropped over $16 billion in sales revenue and managed to increase their gross margin by almost one full point. The cost structure that they had to put in place to ship $75 billion of product for the 2014 holiday didn't magically go away. Apple has to pay for all those fixed costs every month of the year even if sales go down. But even with that, they still increased their gross margins. My guess is that the iPhone 6 Plus supply was constrained during the October through December period but Apple corrected whatever supply chain issues they had in Q2.
So yes, Apple had another great quarter. But does this level of performance support a market capitalization value of $700 billion? If I take the present value of a future of quarters like the last two will it even come close to $700 billion? Remember, the stock price is simply the present value of future earnings. It's like winning the lottery and taking the immediate lump sum payout. The lump sum payout is the present value of twenty years of payments. Likewise, market cap is the present value of all future earnings. Those earnings belong to the stockholders and must be either returned via dividends or reinvested in the company.
The question which perplexes me is if the current level of profitability doesn't support the market cap, how much would Apple have to grow to fulfill expectations? This has been nagging at me for a little while now, but you'll have to check back later to see what the math says.

 RSS Feed