
If international business was the NFL then Tom Brady’s New England Patriots lining up against Peyton Manning’s Denver Broncos would be the equivalent of Apple versus Samsung Electronics. These two giants have had a string of hits recently and have risen head and shoulders above the field. You often hear talk about how much larger Samsung is than Apple, but that depends on how you define Samsung . If you define Samsung as the division that is actually playing on the same field as Apple, that would be Samsung Electronics. This is the crown jewel of the Samsung empire and by far the largest and most prestigious of the groups.
Let’s take a look at their two most recent quarterly income statements.
Let’s take a look at their two most recent quarterly income statements.
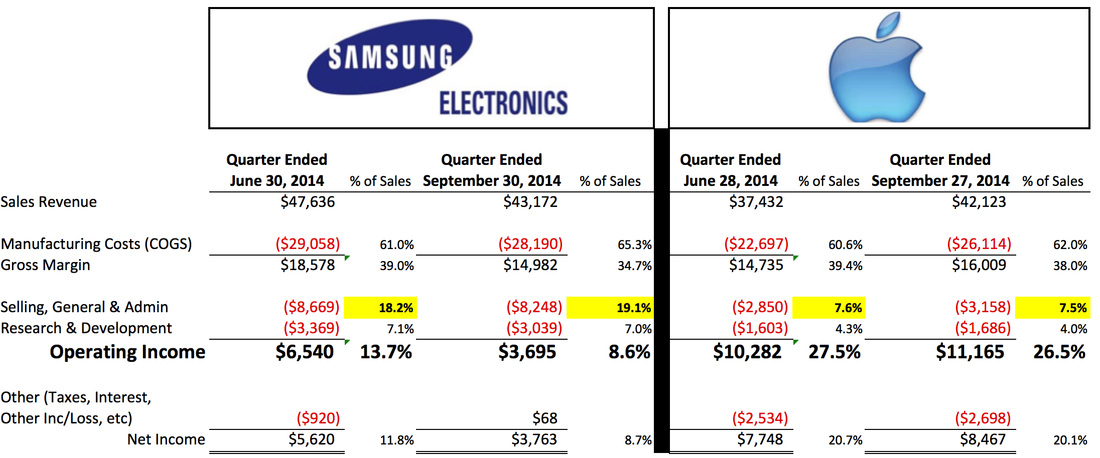
You see in the quarter ended June 2014 that Samsung Electronics brought in $47.6 billion in revenue compared to Apple’s $37.4 billion. That is 27% more revenue than Apple’s. But look at the meltdown that occurred in the next quarter. Samsung’s revenue dropped $4.5 billion while Apple’s revenue was up $4.7 billion. Now the two are nearly equal! It looks even worse if you compare Samsung’s revenue to the same quarter last year when they had $55 billion, a 21% drop in sales.
Manufacturing costs aren’t too much different between Samsung and Apple with both being in the low 60% of sales range. Apple skews towards more expensive materials and components, but they also charge higher prices. So as a percent of sales it’s not too different. Also, you can clearly see how important Samsung’s Galaxy S4/S5 is to Samsung’s overall profitability. It’s been widely reported that sales of the Galaxy S5 have fallen off a cliff, so it’s no coincidence that the gross margins fell from 39.0% to 34.7%. Since most companies get pretty worked up about margin declines measured in terms of tenths of a point, I can only imagine the handwringing going on in Seoul right now.
And what is going on with the selling and general costs at Apple [SG&A]? Highlighted in yellow, notice how much lower than Samsung’s they are. Samsung’s SG&A at 18 or 19% of sales is much higher than Apple’s, but is closer to the norm for a company of this size. This is where all the costs of marketing your products, delivering them to market, and paying for the corporate, non-manufacturing salaries go. Samsung took in about the same amount of revenue as Apple last quarter, yet they paid a heck of a lot more in expenses to do it. SG&A is the biggest reason for the profit disparity between the two companies. I’m sure Apple’s distribution costs are much lower than Samsung’s due to the fact that they are spread among far fewer products, but this couldn’t explain over a billion dollars a month. And I’m sure Apple gets a favorable margin boost from digital sales for which the cost of fuel is irrelevant and headcount is minimal. But even if the $4.1 billion dollars of iTunes revenue had $0 SG&A, that would only account for one full point of the eleven point differential.
So where is the difference? Could Samsung need to spend $5 billion dollars a quarter in advertising and promotions to achieve their sales? Is Apple’s centralized flat management structure yielding massive cost savings? I even wonder if there is some kind of classification difference between how the companies are handling various expenses. For instance, US GAAP (Generally Accepted Accounting Principles) requires costs like labor fringe benefits to be in manufacturing costs, whereas in some countries these could be in general costs. I don’t know the answer to this question but I’d love to get my hands on Apple’s and Samsung’s product line financials to see what the detail is.
Then there are the research and development costs. Samsung spends almost twice as much on R&D, and what do they have to show for it? A whole slew of products that cost more to manufacture, deliver, and market than Apple? If I were a Samsung stockholder, I’d be asking some serious questions on what their labs are working on and whether they are in alignment with the overall corporate goals.
It’s interesting to compare Samsung Electronics and Apple because they are almost the same size in terms of sales revenue and they do compete head-to-head in the mobile arena. But this may be unfair to Samsung much in the same way as comparing an Olympic silver medalist only to the guy who won the gold. Samsung is making a healthier profit margin than Exxon Mobil. Whenever gas prices go up, everyone is asking how much money do those fat cats selling oil really need? But Apple seems to have found the sweet spot, the right balance of product portfolio width and depth. It’s wide enough to capture sales revenue that rivals a small country's entire GDP but not so wide that they begin to lose efficiencies. In addition, it’s deep enough that attention to design, quality, and customer service inspire intense customer loyalty.

 RSS Feed