

Greater minds than mine can debate whether or not Apple can or should offer a completely new iPhone every single year. Whether or not this would increase iPhone sales volume for Apple or if it’s even possible is beyond me.
What I can do is estimate what the impact of an annual refresh would have on the iPhone product line income statement. When you are trying to guess what Apple may or may not do in the future it sometimes helps to attach a price tag to their various options.
What I can do is estimate what the impact of an annual refresh would have on the iPhone product line income statement. When you are trying to guess what Apple may or may not do in the future it sometimes helps to attach a price tag to their various options.
*** Warning -- Graphic numbers immediately ahead ***
*** Skip to the “The Bottom Line” if this could induce a violent allergic reaction or put you into a coma ***
Estimating the iPhone’s Overhead
Since the iPhone is by far the largest product in Apple’s portfolio, I’m using the corporate average gross margin of 39% as the iPhone gross margin and working my way back. Whether this is too high or too low by a few points isn’t too big a deal because what I really want is the differential between my two scenarios. Even a broken scale can give you an idea of how much weight you’ve lost. There are estimates floating around on how much the Material and Labor portions for the iPhone cost. So once you have two out of the three components, you can solve for X.
Gross Margin = 38.6%
iPhone Price = $849
Gross Margin $: $849 x .386 = $328
Sales – Cost of Goods Sold = Gross Margin
$849 – COGS = $328
COGS = $521
(Material + Labor) + Overhead = COGS
$227 + OH = $521
OH = $294
Estimating Depreciation
Estimating the iPhone’s total overhead costs per unit isn’t too difficult based on the information that is floating around already. But the smaller sub-set of overhead that is specifically depreciation and quantifying the tiers is going to have to be a guess. However, a reasonable guess is possible. When you study and analyze product line income statements for over twenty years, you definitely develop rules of thumb that allow you to quickly guesstimate impromptu scenarios. Kind of like a contractor giving a quote on remodeling your kitchen. He’s replaced so many sinks and countertops that he can quickly give you a ballpark quote on the spot without actually going through a complex spreadsheet for your specific remodel.
I have two decades of analyzing income statements at the product-line level. I’m not a writer, I’m a manufacturing financial analyst. Based on what I’ve seen and what I know to be true in the hardware side of things, I’m guessing that depreciation is going to have a 1:3 ratio to the rest of overhead in the iPhone income statement. If I estimate that revenue is at around $300 billion for a two-year lifecycle, that means capital spending for hardware comes in at around 12% of sales. Which is about right from a sniff test. Material is always your largest expense and labor is your smallest. Overhead will always be in the middle between material and labor, and the ratio of depreciation to overhead depends on how automated the process is. High volume products that rely on lots of robots, equipment, and control software will have much more depreciation than lower volume products which are typically very labor intensive.
The Bottom Line
Based on my mini-model, I’m estimating that Apple spends about $105 per iPhone in depreciation charges. But there would be two different tiers of depreciation—one for the one-year components and another for the two-year components. The one year components would be items like the processor and camera that get upgraded annually, so Apple would depreciate them over their useful life of one year.
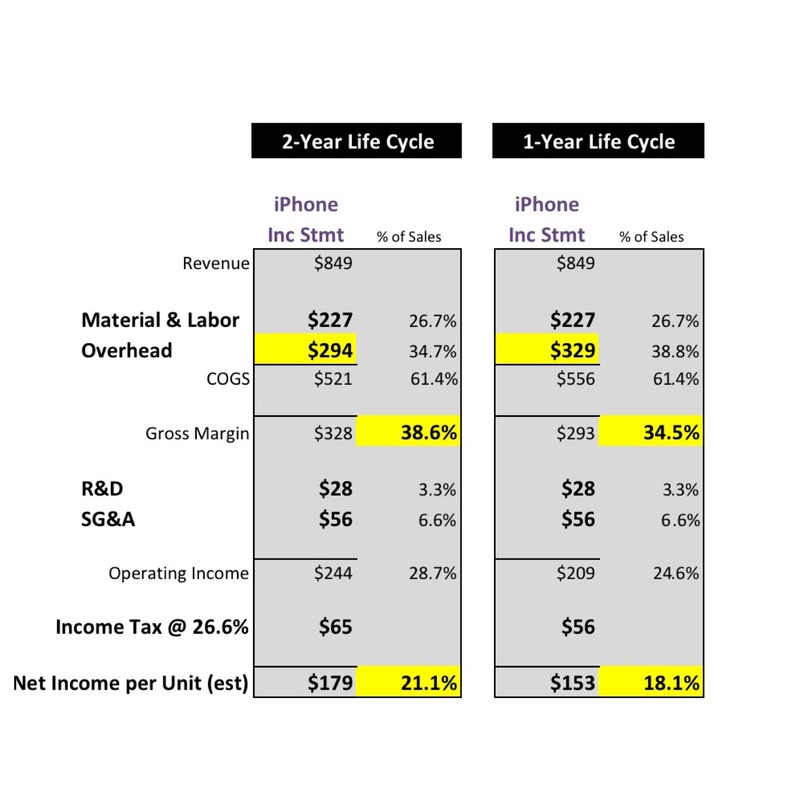
Only tier 2 for the two-year components would be affected by moving to an annual cycle. This would mean that $17.5 billion in capital would get spread over 250 million units instead of 500 million. This would result in an additional $35 of cost per unit.The bottom line is that the iPhone would absorb a hit to the gross margin of 4.1 percentage points.
The Fixed-Cost Allocation Issue
Anyone who thinks that Apple is large enough to not have to worry about fixed cost allocations is mistaken. Huge scale allows you to spread your fixed costs over more volume, giving you higher profitability. But the reverse is just as true. Decreasing your volume will increase your costs just as fast. And Apple’s tooling cost problem is probably worse than most other large companies because Apple is ramping up to huge volumes with unprecedented speed. That speed costs money in the form of additional production lines. These assets are all bought and paid for up front before manufacturing begins. Apple doesn’t get to purchase any less machinery if they decide to manufacture a form factor for one year vs two.
The billions of dollars that Apple spends on production lines before Apple ever sells a single iPhone don’t hit the income statement until each iPhone gets shipped. That’s the wonder of capitalization. That means that Apple doesn’t recognize any cost on their income statement for equipment purchased in 2015 until they sell a product which may be as late as 2017. So they can either spread their $35 billion in depreciation costs over 250 million iPhones in one year or 500 million iPhones in two years. No amount of economies of scale is going to help them escape simple overhead absorption. Moving to one year will necessarily hurt the bottom line.
$30-$40 billion in capital asset spending may sound like a lot, but in comparison to the $300 billion in revenue it generates, not so much. Compared to $150 billion though? It’s a tough pill to swallow. Those capital costs seem a lot higher when compared to half the revenue.
Cost vs Benefit
The proponents of an annual cycle would argue that the higher depreciation costs would be justified since sales would be higher. Okay then, let’s see what they’ve just signed up for. In order to make up for swallowing an additional $17.5 billion in capital costs, Apple needs an additional $83 billion in revenue per year to make up for the loss of absorption. That equates to between 100-130 million more units sold per year. Could Apple drive a 50% sales increase by doing this? Sounds unlikely to me. Or Apple could simply decide to take lower margins in the hopes of increasing market share.
Whether the increase in market share is worth the loss of 4.1 points in margin is a tough question. That’s why the executive team gets paid the big bucks—they gotta make the hard choices. The finance guys can’t make that choice for them. They can only attach the price tags and display the options.
One way Apple could mitigate the impact of moving to an annual iPhone model would be to make people wait longer to get the new model. If people were willing to wait months to get their new iPhone the way people wait months for a new car model, then perhaps shortening the lifespan wouldn’t be so bad. But Apple tries to ship an enormous amount of product within the first thirty days, let alone the first three months. The problem is that the speed with which Apple tries to ramp up volumes necessitates greater expenditures on machinery and equipment.
I'm sure that Apple could still sell over 200 million iPhones per year with significantly less spending on capital. But that would mean that fewer manufacturing lines would be cranking out units and lead times would go up. That’s a dangerous game to play, because customers often won’t wait for your product and will buy from your competitor. But if anyone can count on customer loyalty, it’s proven to be Apple.
My professional advice to Apple would be to stick with a two-year life cycle for the iPhone. If top management was dead set on going to one year, I would then recommend that they lengthen launch lead times and try soften the financial blow. But I’m an accountant, what do you expect?
Apple doesn’t strike me as the kind of company that would ever rush big design decisions. Creating mock-ups of proposed products and living with them in real life to see what they’re like takes a lot of time. They also seem to relish ruminating on the design so laboriously. I kind of doubt that even if the numbers made good financial sense that Apple would be able to move to an annual refresh cycle. It’s what makes Apple…Apple.
*******************************************************************************
5/24/16 Update - I thought I should note that not all capital assets related to iPhone production are necessarily carried on Apple's balance sheet. Therefore you can't go look at what Apple has capitalized for machinery and equipment to get a picture of how many dollars it requires to produce the iPhone. Depending on how the purchasing agreements are structured, the assets could be carried by the vendor manufacturing the phones. In this case the depreciation is still allocated to each unit, but for Apple it would show up under Material. The way assets are handled varies by vendor. For the sake of simplicity, I kept it all in overhead. This would have no impact on the calculated gross margin change.

 RSS Feed